mapper.js 2.4 allows you to add automatic area highlighting to image maps on your webpages (inc. export to SVG).
It works in all the major browsers - Mozilla Firefox 1.5+, Opera 9+, Safari and IE6+. On older browsers, it can use
"jsgraphics" from Walter Zorn (if installed), else it'll degrade and your visitors won't notice a thing.
Demonstration
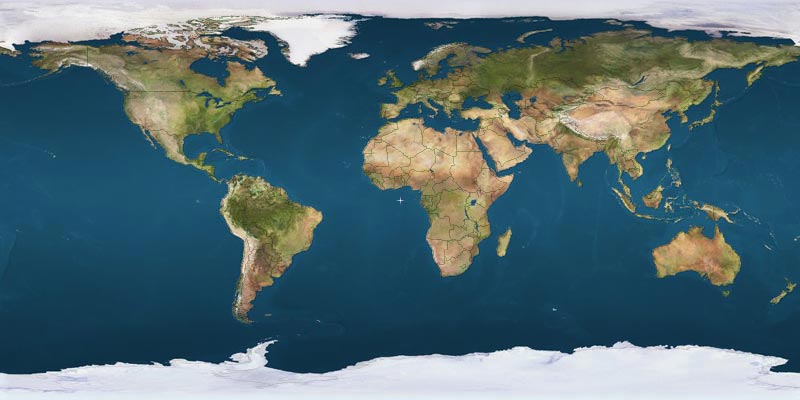
Image with class "mapper showcoords noborder iopacity50 icolorff0000" (Coordinates output example). Image reference (public source): http://flatplanet.sourceforge.net/maps/
This SVG was generated from map data via "maputil.js" (part of distribution). Generate SVG from map data via "maputil.js".
Image with class "mapper" only.
The colored circles uses multiple area selections through rel="id_11,id_21,id_9...".
The blue and red squares forces the corresponding groups to use their attributes by "forcegroup".
This SVG was generated from map data via "maputil.js" (part of distribution). Generate SVG from map data via "maputil.js".
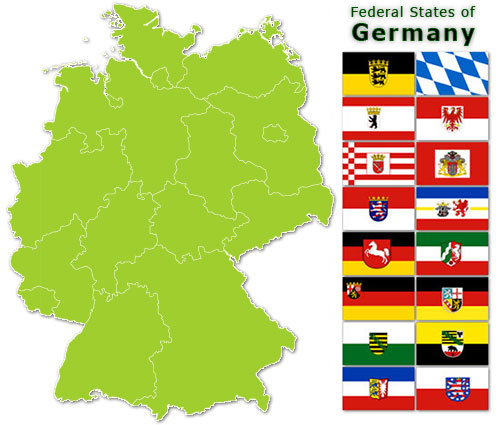
Congratulations, Mr. President
Image with class "mapper iborder00aa00 icolor00ff00".
All not blue colored country areas with class "noborder icolor808080".
This SVG was generated from map data via "maputil.js" (part of distribution). Generate SVG from map data via "maputil.js".
Image with class "mapper noborder iradius16 iopacity50 icolorff0000".
Images used are copyrighted and are used for demonstration only (use the shape data).
Setting Up
Download mapper.js and include it into your webpage.
vary the appearancy by adding iradius followed by the desired radius as pixel:
Corner appearancy class "iradius" - min=0 max=100 default=0
vary the fill by adding iopacity followed by the desired opacity in percent: *Fill opacity class "iopacity" - min=1 max=100 default=33
vary the fill by adding icolor followed by the desired color as hex: *Fill color class "icolor" - min=000000 max=ffffff default=000000
vary the fill appearancy by setting nofade:
Fill appearancy class "nofade"
vary the border by adding iborder followed by the desired color as hex: *Border color class "iborder" - min=000000 max=ffffff default=0000ff
vary the border visibility by setting noborder: *Border visibility class "noborder"
get the relative mouse position within the image by setting showcoords:
Coordinates output class "showcoords"
vary the group appearancy by setting forcegroup: **Group appearancy class "forcegroup"
*These classes work also in conjunction with<area>objects! **This class works only in conjunction with<area>objects!
To work with the constant coordinates stream, define a function named
"showCoords(map_name,area_id,xpos,ypos,width,height)" after "mapper.js" was loaded.
showCoords() options:
map_name current map name e.g. world_map
area_id current area id e.g. 0 | world_map_112
xpos current x position within image e.g. 482 (pixel value)
ypos current y position within image e.g. 175 (pixel value)
width current image height e.g. e.g. 800 (pixel value)
height current image height e.g. 400 (pixel value)
You can use a predefinded div object named map_name+"_blind" with the class
"blind_area" as an overlay for any additional output!
Scripting
If you want flexibility, use "cvi_map_lib.js" instead of "mapper.js".
You can make your maps respond to user actions. Check the cvi_map_lib.js: example!
cvi_map.add(image, options); image should be an div surrounded image element: document.getElementById("myimg") options can contain one or more values: {radius: value, opacity: value,bordercolor: value, areacolor: value,noborder: value, nofade: value,delayed: value,showcoords: value}
cvi_map.modify(image, options); image should be an image element: document.getElementById("myimg") options can contain one or more values: {radius: value, opacity: value,bordercolor: value, areacolor: value,noborder: value, nofade: value,delayed: value,showcoords: value, imgsrc: value, mapid: value}
If the imagemap has already an effect but a option value has changed, the effect will be changed accordingly.
makeSVGfromMap() parses the style attribute of <area /> tags for fill and stroke styles to complete the SVG!
scaleMapAreaCoords()
scaleMapAreaCoords(map, nw, nh, sw, sh, options); map should be a map element: document.getElementsByName("myimg")[0] nw = width e.g. 800 (natural image width as pixel value) nh = height e.g. 400 (natural image height as pixel value) sw = width e.g. 400 (scaled image width as pixel value) sh = height e.g. 200 (scaled image height as pixel value)
options (contains zero or more values)
arg1xoff e.g. -2 (horizontal offset as pixel value)
arg2yoff e.g. -2 (vertical offset as pixel value)
Note:
scaleMapAreaCoords() opens a window with the source!
Why use Javascript Image Mapper?
Fast and easy to implement. Just add class="mapper" to the image and you're good to go.
Don't need to spend time in an image editor creating dozens of images for the same effect.
Works and looks really well. Doesn't require additional resources.
It's dead easy to change the attributes of the images.
Free of charge use on non-commercial and private web sites.
In older browsers, the script degrades and your visitors won't notice a thing.
Download
Please read the license before you download mapper.js 2.4
mapper.js and maputil.js are distributed under the Netzgestade Non-commercial Software License Agreement.
License permits free of charge use on non-commercial and private web sites only under special conditions (as described in the license).
This license equals neither "open source" nor "public domain".
There are also Commercial Software Licenses available.
YOU AGREE TO ALL CONDITIONS OF THIS LICENCE AGREEMENT CONCERNING THE USE OF THE SOFTWARE BY ACCEPTING THIS LICENCE.
IF YOU DO NOT AGREE TO ALL CONDITIONS OF THIS AGREEMENT, YOU SHALL NOT INSTALL THE SOFTWARE, OR USE IT IN OTHER WAYS.
mapzoom.js Supports zoom & pan for pixel & vector data! It's a conceptual combination of ShiftZoom and Mapper. Requires no plugin/extension or any other external resource!
shiftzoom.js Supports zoom & pan functionality! The library allows you to add/remove zoom and pan functionality to oversized images on your webpages. Requires no plugin/extension or any other external resource!
snapfit.js Supports jigsaw puzzle functionality! The script allows you to add jigsaw puzzles with individual options to images on your webpages. Requires no plugin/extension or any other external resource!
booklet.js Simulates an authentic looking album or book presenting photos, images and pictures of all sizes and with any aspect ratio. Includes covering, navigation, information, linking and auto generated visual table of contents. Requires no plugin/extension or any other external resource!
tripleb.js Simulates the CSS 3 beautifying features border-radius, box-shadow and background-gradient on your webpages. Requires no plugin/extension or any other external resource!
loupe.js Simulates an authentic looking magnifying glass! The script allows you to add a loupe for magnifying (inc. start viewpoint) to an image on your webpage. Requires no plugin/extension but one external resource image!
busy.js Supports native spinner animations! The library allows you to add/remove loading indicators to the viewport and to block-level elements on your webpages. Requires no plugin/extension or any other external resource!
glossy.js Simulates a glossy shaded and beveled button look! The script allows you to add individual corners, shadings and shadows to images on your webpages. Requires no plugin/extension or any other external resource!
slided.js Simulates a slide frame look including gradients! The script allows you to add individual colors, shadings and shadows to images on your webpages. Requires no plugin/extension or any other external resource!
corner.js Simulates a whole bunch of image effects! The script allows you to add individual corners, shadings and shadows to images on your webpages. Requires no plugin/extension or any other external resource!
transm.js Supports programmable image transitions! Features 113 transitions, 32 tweenings, individual corners, overlay graphics and event actions. Requires no plugin/extension or any other external resource!
gauge.js Supports programmable gauges! The script allows you to add gauges (with shading and reflection) to your webpages. Requires no plugin/extension or any other external resource!
filmed.js Simulates a film strip look including reflection! The script allows you to add individual colors, shining and shadows to images on your webpages. Requires no plugin/extension or any other external resource!
edge.js Simulates masked image edges! The script allows you to add individual masks (inc. inbuilt mask) to images on your webpages. Requires no plugin/extension but zero or more external mask images!
sphere.js Simulates a spherical image effect! The script allows you to add an spherical picture effect with individual zooming, shading, shining, transparency and colors to images on your webpages. Requires no plugin/extension or any other external resource!
bevel.js Simulates a whole bunch of image effects! The script allows you to add bevels with individual glowing, shading and shining to images on your webpages. Requires no plugin/extension or any other external resource!
curl.js Simulates a page curl image effect! The script allows you to add curls with individual paperback color, shadow opacity and size to images on your webpages. Requires no plugin/extension or any other external resource!
instant.js Simulates an instant picture look including tilt! The script allows you to add individual colors, tiltings and shadows to images on your webpages. Requires no plugin/extension or any other external resource!
reflex.js Simulates a Cover Flow™ image effect! The script allows you to add individual borders, tiltings and reflections to images on your webpages. Requires no plugin/extension or any other external resource! *Cover Flow is a trademark of Apple Inc.

 mapper.js and maputil.js are distributed under the Netzgestade Non-commercial Software License Agreement.
License permits free of charge use on non-commercial and private web sites only under special conditions (as described in the license).
This license equals neither "open source" nor "public domain".
There are also Commercial Software Licenses available.
mapper.js and maputil.js are distributed under the Netzgestade Non-commercial Software License Agreement.
License permits free of charge use on non-commercial and private web sites only under special conditions (as described in the license).
This license equals neither "open source" nor "public domain".
There are also Commercial Software Licenses available.